|
New updates to Webcourses@UCF ͏ ͏ ͏ ͏ ͏ ͏ ͏ ͏ ͏ ͏ ͏ ͏ ͏ ͏ ͏ ͏ ͏ ͏ ͏ ͏ ͏ ͏ ͏ ͏ ͏ ͏ ͏ ͏ ͏ ͏ ͏ ͏ ͏ ͏ ͏ ͏ ͏ ͏ ͏ ͏ ͏ ͏ ͏ ͏ ͏ ͏ ͏ ͏ ͏ ͏ ͏ ͏ ͏ ͏ ͏ ͏ ͏ ͏ ͏ ͏ ͏ ͏ ͏ ͏ ͏ ͏ ͏ ͏ ͏ ͏ ͏ ͏ ͏ ͏ ͏ ͏ ͏ ͏ ͏ ͏ ͏ ͏ ͏ ͏ ͏ ͏ ͏ ͏ ͏ ͏ ͏ ͏ ͏ ͏ ͏ ͏ ͏ ͏ ͏ ͏ ͏ ͏ ͏ ͏ ͏ ͏ ͏ ͏ ͏ ͏ ͏ ͏ ͏ ͏ ͏ ͏ ͏ ͏ ͏ ͏ ͏ ͏ ͏ ͏ ͏ ͏ ͏ ͏ ͏ ͏ ͏ ͏ ͏ ͏ ͏ ͏ ͏ ͏ ͏ ͏ ͏ ͏ ͏ ͏ ͏ ͏ ͏ ͏ ͏ ͏ ͏ ͏ ͏ ͏ ͏ ͏ ͏ ͏ ͏ ͏ ͏ ͏ ͏ ͏ ͏ ͏ ͏ ͏ ͏ ͏ ͏ ͏ ͏ ͏ ͏ ͏ ͏ ͏ ͏ ͏ ͏ ͏ ͏ ͏ ͏ ͏ ͏ ͏ ͏ ͏ ͏ ͏ ͏ ͏ ͏ ͏ ͏ ͏ ͏ ͏ ͏ ͏ ͏ ͏ ͏ ͏ ͏ ͏ ͏ ͏ ͏ ͏ ͏ ͏ ͏ ͏ ͏ ͏ ͏ ͏ ͏ ͏ ͏ ͏ ͏ ͏ ͏ ͏ ͏ ͏ ͏ ͏ ͏ ͏ ͏ ͏ ͏ ͏ ͏ ͏ ͏ ͏ ͏ ͏ ͏ ͏ ͏ ͏ ͏ ͏ ͏ ͏ ͏ ͏ ͏ ͏ ͏ ͏ ͏ ͏ ͏ ͏ ͏ ͏ ͏ ͏ ͏ ͏ ͏ ͏ ͏
In This Email
- Quick Tip: Message Students from Analytics Beta
- What's New with Webcourses@UCF
- Design with Quality in Mind: Grading Criteria
- Kelvin's Corner - Student Success Data
|
|
 Message Students from Analytics Beta
|
|
|
|
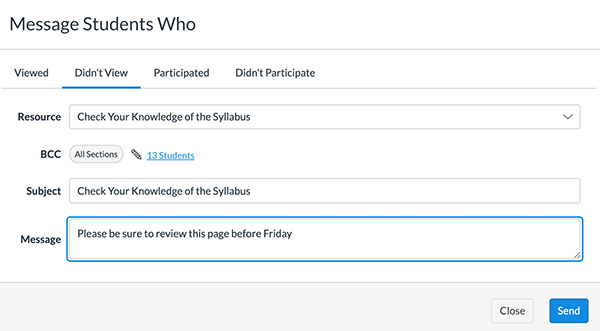
Analytics Beta is a tool in Webcourses@UCF that allows instructors to track average course grades for student submissions and participation using an interactive chart graph or table. You can use Analytics Beta to send a message to all students -- or individual students -- based on specific course grade or participation criteria. The image below demonstrates an instructor messaging students who have not viewed a resource in the first module of the course. For more information visit Canvas Guides for Analytics Beta.
|
 |
|
What's New with Webcourses@UCF
This weekend's update will include the following changes or new features: |
|
|
New Gradebook - Post Policy Icon Updates
The word MANUAL now displays in the assignment header to indicate the assignment is set with the Manual Posting Policy. Additionally, the outlined Visibility icon only displays when entered grades need to be posted. - This change helps simplify the number of icons related to the manual posting policy and provide icon consistency throughout Canvas.
- Assignments set with the Automatic Posting Policy do not include any additional indicator aside from the point value.
|
|
Navigation Menu
The Admin, Course, and User Navigation Menus have been updated to include color and visual indicators to define active menu items. Additionally, the Course Navigation Menu includes tooltip indicators to clarify inactive menu items. This change helps improve accessibility in Canvas. Previously the inactive links displayed in light gray text with a light border, which did not fulfill contrast ratios. Additionally, active and inactive links only relied on color to convey information.
|
|
Analytics Beta - New Course and User Analytics
Weekly Online Activity data has been added to Analytics Beta. It now displays both Course Grade and Weekly Online Activity data, as selected in the menu.
|
|
- Course Grade allows instructors to view the average course grade for all course data using an interactive chart or table. Additionally, instructors can filter analytics results to compare the average course grade with a specific section or student and quickly access assignment data. For more details about Course Grade functionality, please see the Course Grade Analytics Summary page.
- Weekly Online Activity allows instructors to view the average number of page views and participations for a course using an interactive chart or table. Additionally, instructors can filter analytics results to compare the average course activity with a specific section or student. For details about Weekly Online Activity functionality, please see the Weekly Online Activity Analytics summary page.
|
|
Design with Quality in Mind: Grading Criteria
|
|
|
|
Looking for tips on how to design your online courses? Design with Quality in Mind is a series of brief articles that explores best practices in online course design. Each post in this series will highlight one item that exemplifies quality online course design, based on UCF’s Quality Course Review items, and showcases examples from UCF faculty. The first post of the series, Describe How your Learning Activities Will be Graded, explains why describing grading criteria for each learning activity improves the quality of your online course and showcases examples from UCF faculty who are incorporating rubrics in their online courses.
|
|

Training Faculty to Use Student Success Data
Faculty access and use of institutional data can inspire action and transform teaching. Today’s Kelvin’s Corner resource is a Solutions for Higher Educationpodcast from Southern Utah University (SUU) featuring a conversation between hosts SUU President Scott L. Wyatt and Professor Steve Meredith with guest Jeff Gold (CSU System). Titled ‘Training Faculty to Use Student Success Data’, this 44 minute episode discusses the personal empowerment of faculty accessing and using institutional or system data “to understand the impact of what they’re doing and how to improve it.”
Kelvin Thompson is the Executive Director for the Center for Distributed Learning. He is always finding, sharing, recommending interesting and insightful resources about teaching and learning.
|
|
Tips, Tools, & Resources
Stay connected to the Division of Digital Learning |
|
|
|